

Philips Healthcare Tool
VX850 Ventilator Wireframes
Overview
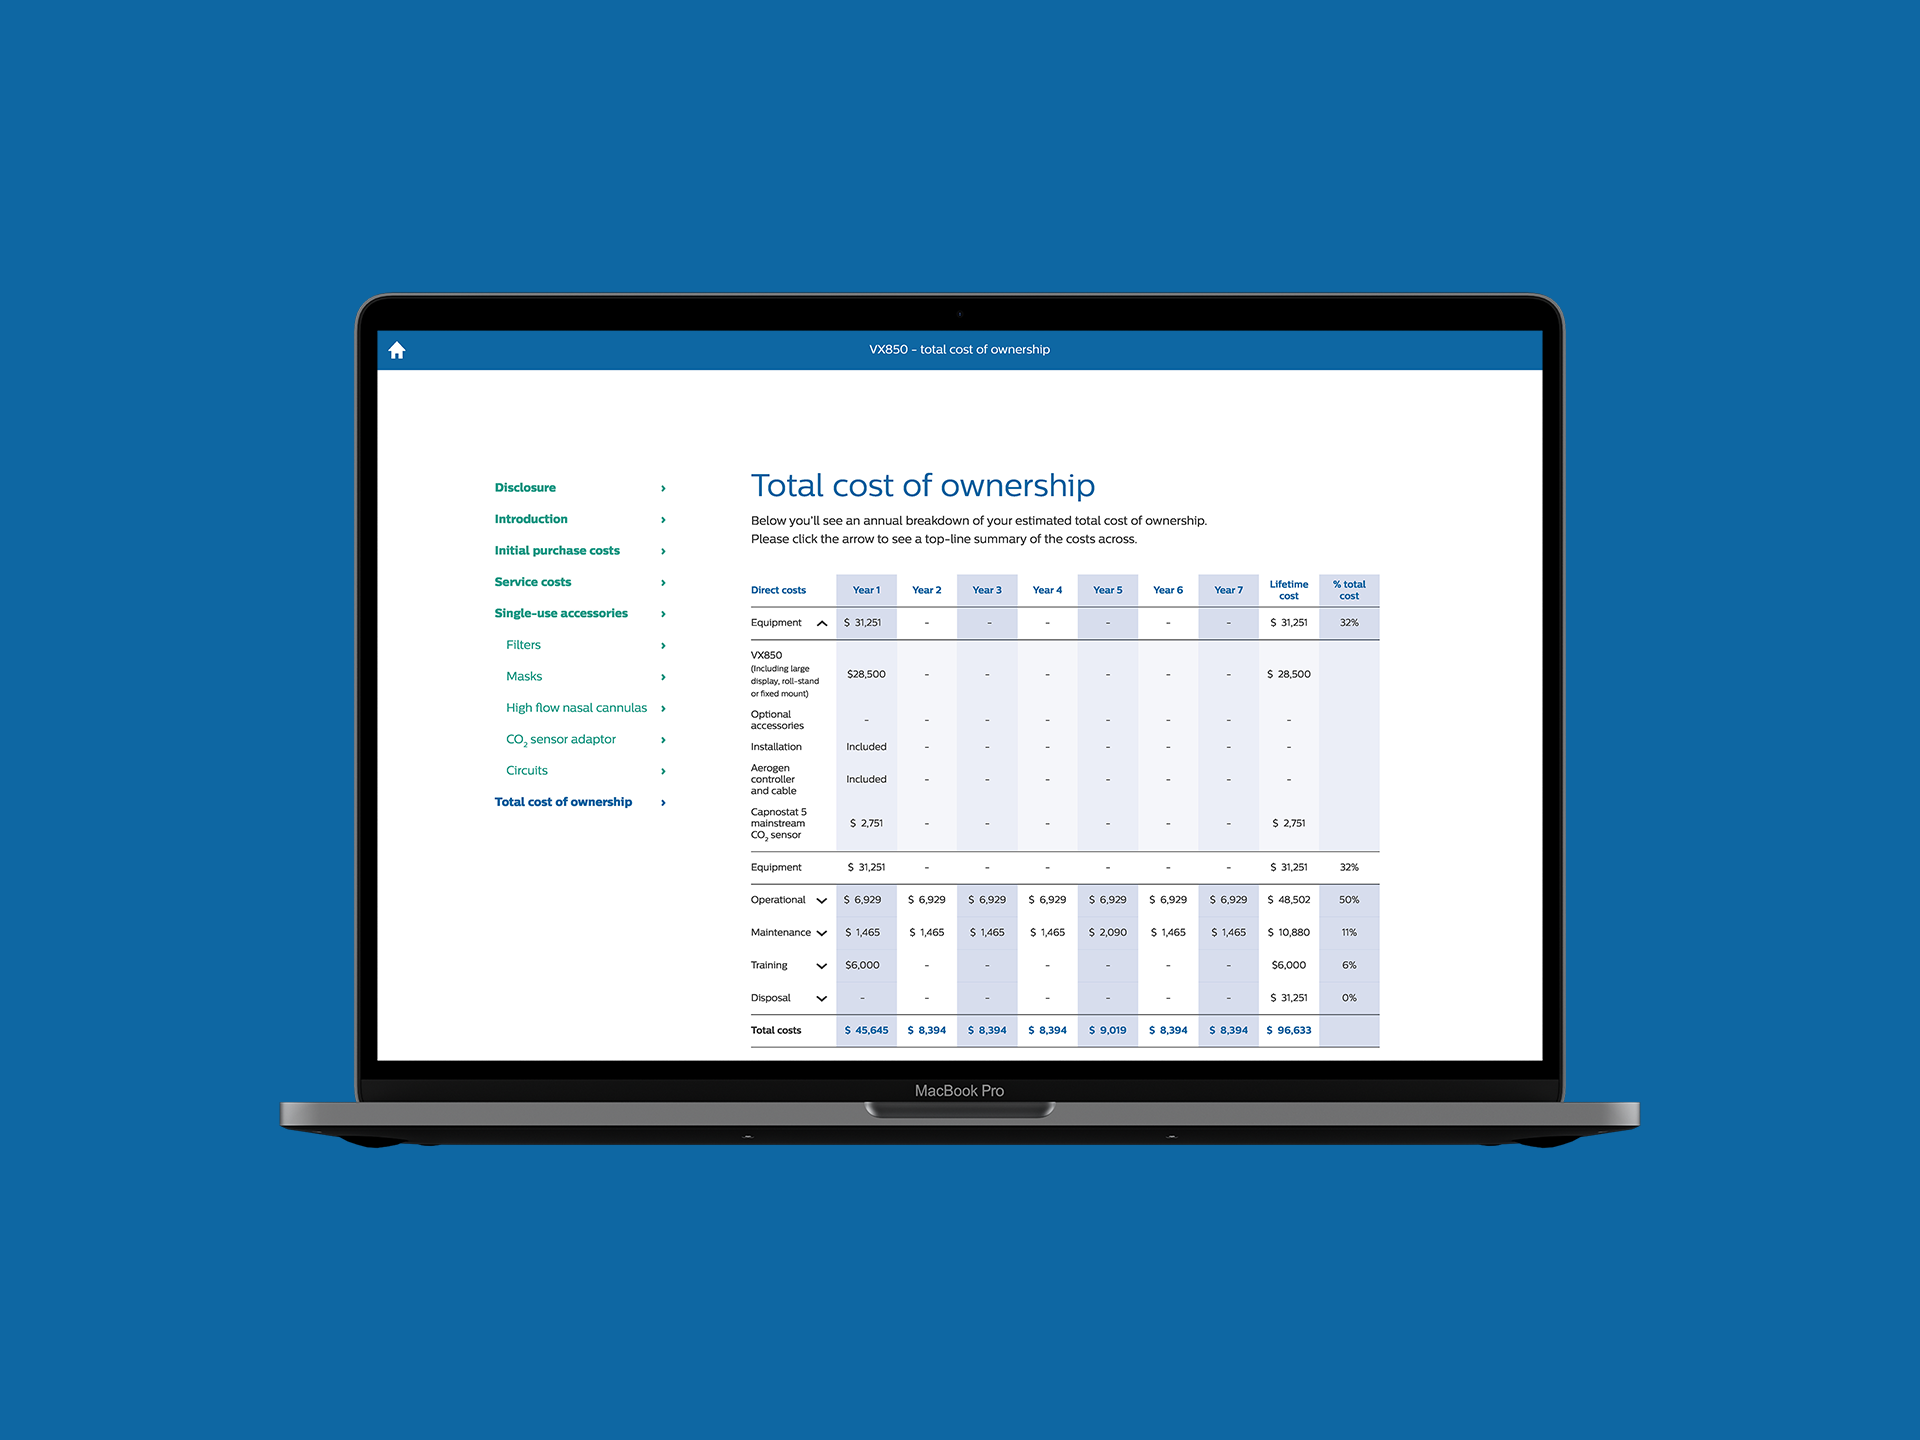
Here are some wireframes designed in Adobe XD. Using existing branding I designed a very clean and clear UI for the user to navigate through the tool. The menu buttons to the left of each page have states to indicate where the user is. The disabled states (greyed out) indicates that they can’t proceed until they’ve filled in the fields on the current page.
When the user arrives at the total cost of ownership tables, it’s easy to collapse certain rows to compare two particular columns. I included a universal style guide to make it easy for the developer to refer back to when building this tool.
User flow video
Please take a look at the video exploring the user flow through this detailed wireframe walkthrough.